Benchmarks
For an adoption checklist and comparison of caching layers, start with Should you use this?.
Is caching a good fit for your workload?
Before enabling the cache for a workload, weigh these factors — each is covered by the retained reports or by deployment guidance:
- Read/write ratio. Caching benefits read-heavy and balanced workloads the most; a write-dominant workload pays
the cost of processing a change-stream event and invalidating cache entries on every write, while a shrinking
share of reads ever reach a warm entry before it's invalidated again. Compare the
read_heavy,balanced, andwrite_dominantreports for a sense of the difference. - Query shape.
find_onefilters that pin an exact_idunder simple collation, including additional predicates, and qualifying unique-indexfind_onereads survive writes to other documents. Other cached reads in a frequently written collection mostly miss, and each miss costs more than a direct read. See the invalidation scope research for the measured workload and limits. - Topology and process model. Caching a database costs one change-stream cursor per active database per
CacheManagerinstance (see capacity estimation); a high-fan-out or short-lived-process deployment, or a manager watching many databases, pays that fixed cost more often or more times over, which can outweigh the benefit for that deployment shape even when the read/write ratio looks favorable. - Document size. Larger documents cost more to admit and encode into the cache and are more likely to exceed
max_entry_bytesand bypass entirely. Compare the small/medium/large report variants for a workload with a document size similar to yours. - Stream health. Caching only helps while a database's change stream is healthy; a database with frequent network interruptions, or a MongoDB server or topology that can't provide change streams at all (see system requirements), bypasses the cache for that traffic instead of raising an error.
None of the reports establishes a performance guarantee for your own workload, host, or MongoDB topology — use them to decide what to measure on your own deployment before relying on the cache in production.
Illustrative read latency
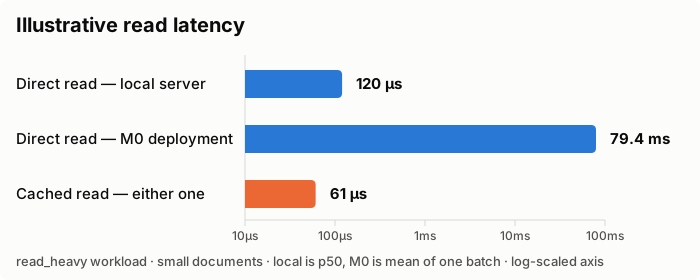
Read latency across two different deployments, so you can see the range: the local-server row is the median from one of the retained local benchmark reports; the M0-deployment row is the mean of one batch from the real-server benchmark against a free-tier Atlas (M0) cluster — plotted on a logarithmic axis given the size of the gap. Cached-read latency barely moves between the two, since a cache hit never touches the network. Neither number is a universal performance guarantee for your own workload or deployment — see Stream cost benchmarks for the full local workload matrix and how to reproduce it.
See stream cost measurements for the retained workload matrix, await-time and compression evidence, reproduction commands, and measurement limitations.
Multiple workers with concurrent writes
One benchmark compared direct PyMongo reads with a cache manager in each worker process while writes kept changing the cached documents. One or four asyncio worker processes served 1,831 find_one() reads per second by _id across 1,024 documents of 4 KiB, and one update every 20 reads changed one of those documents. Everything ran on one 8-thread host, with MongoDB in a local single-member replica set.
| Measure | 1 worker, direct → cached | 4 workers, direct → cached |
|---|---|---|
| Median request latency | 1.13 → 0.67 ms | 1.58 → 0.98 ms |
| 99th percentile latency | 9.5 → 4.0 ms | 5.9 → 5.3 ms |
| Worker CPU per read | 374 → 271 µs | 948 → 893 µs |
| MongoDB CPU | about 9% higher cached | about 10% higher cached |
| Memory of all workers | 52 → 58 MiB | 184 → 205 MiB |
| Reads answered by the cache | 95% | 80% |
Each update removes the cached document from every worker, so more workers mean more misses. MongoDB still processed every update, fed one change stream per worker and served those misses, and its CPU did not fall with caching in this workload. In 95% of cases, a cached worker saw an update within about 9 ms of its commit.
These figures describe this workload and host, not a guarantee for yours. A remote MongoDB adds network latency that a cache hit avoids (see illustrative read latency), and other write rates, document sizes or worker counts change the balance. Maintainers can read the research report for intervals, limits and reproduction commands.
Performance regression guard
The repository compares representative cache operations between the base and proposed revisions of a pull request on the same runner. This check helps detect cache performance regressions; it does not establish a performance guarantee for your application or replace the broader stream cost measurements. Maintainers can read the guard policy source for workloads, thresholds, reports, and review exceptions.